|


| |
Most people understand that, the farther you are away from an event, the less likely you are to be affected
by it. Indeed, distance from the source of a vibration is probably the single most important factor, after the amount of energy that goes into creating the vibration (i.e. the "source energy"), in determining both whether
it will have damaging effects on a home or structure
and how disturbing people will perceive it. Here, I'll
provide an introduction to the complex matter of how vibration
velocities (intensities) decrease with distance. I will discuss some of the basic factors which affect vibration movement through the ground, how vibration velocities (peak particle velocities, PPV's) can be mathematically calculated (as plotted at left) and the
significant cautions that one must observe in using those
estimates. This chapter of the CVDG is heavily footnoted with scientific references and additional detail, which those with more than a passing interest will want to read. About the PPV/Distance Diagrams
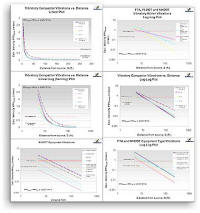 There are several diagrams of calculated vibration velocities and safe distances in this chapter
of the CVDG, like
those at right and above. Calculated ground vibration velocities can be read off any of the diagrams
for any distance from 5 to 250 feet from the vibration source just by noting where the distance to the construction work (source)[15] intersects the appropriate curve, then reading the velocity at that intersection from the vertical scale. You can view, in a new tab or window (and print a copy from your web browser for personal use, if you wish), a full-size version of the distance-ground vibration velocity and safe distance relationships which
follow just by clicking on each diagram.[8] Registered CVDG for Homeowners and CVDG Pro purchasers can also download a complete free PDF
collection of full-sized versions of all the vibration velocity diagrams in this chapter of the CVDG. There are several diagrams of calculated vibration velocities and safe distances in this chapter
of the CVDG, like
those at right and above. Calculated ground vibration velocities can be read off any of the diagrams
for any distance from 5 to 250 feet from the vibration source just by noting where the distance to the construction work (source)[15] intersects the appropriate curve, then reading the velocity at that intersection from the vertical scale. You can view, in a new tab or window (and print a copy from your web browser for personal use, if you wish), a full-size version of the distance-ground vibration velocity and safe distance relationships which
follow just by clicking on each diagram.[8] Registered CVDG for Homeowners and CVDG Pro purchasers can also download a complete free PDF
collection of full-sized versions of all the vibration velocity diagrams in this chapter of the CVDG.
How Far Away Is "Far Enough"?
Although questions like this are often asked and conclusions given, there is no single answer to the question, "How far away must my building be from a vibration source to be considered 'safe' from vibration damage[?]".
Buildings have different degrees of resistance to vibration damage depending on design, construction materials and age, among other factors.[28] As discussed
below, both vibration source properties (e.g. pile driving vs. compaction) and the way vibration velocity decays through movement in the
ground can be very different, depending on locale, presence or absence of structures and other obstructions which can damp, reflect, refract or modify vibration waves. Resonance effects in homes
and other buildings can turn an "allowable" ground vibration
into a structure vibration which is damaging at considerably greater distance than the direct ground vibration itself might be. Even the specific way in which an operator carries out a certain construction operation (e.g.
compaction) can have a very large impact on the vibrations created.
Commonly-asserted statements like, "You are too far away from the work to have damage", have
meaning, at most, only in the
limited sense of relative probability of damage (see Vibration and Damage), even in the comparatively rare examples in which they are correctly founded upon real scientific insight.
Given the many uncertainties which surround vibration damage probability for a given situation and structure, the best, safest, and, in the end, the cheapest approach is usually the one which minimizes the probability of damage in every
reasonable way
possible.
Spreading and Decrease of Vibration
Energy 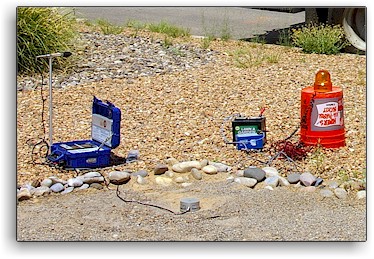 As discussed generally in the CVDG's Vibration 101 chapter, vibration peak particle velocities, PPV's, decrease as distance
from the source increases. Stated more scientifically, the
vibration velocities depend "inversely" on distance. The inverse dependence is, at root, mostly a geometric effect. For body waves, the vibration velocity decreases as a given amount of source vibration energy spreads out over a sphere,
whose area increases as the radius squared. Although the geometry can explain a good deal of the decrease of vibrations with distance, soil compositions, including the amount of water they carry, also affect the vibration intensity through their different degrees of damping. As discussed generally in the CVDG's Vibration 101 chapter, vibration peak particle velocities, PPV's, decrease as distance
from the source increases. Stated more scientifically, the
vibration velocities depend "inversely" on distance. The inverse dependence is, at root, mostly a geometric effect. For body waves, the vibration velocity decreases as a given amount of source vibration energy spreads out over a sphere,
whose area increases as the radius squared. Although the geometry can explain a good deal of the decrease of vibrations with distance, soil compositions, including the amount of water they carry, also affect the vibration intensity through their different degrees of damping.
Ground vibration intensities are usually measured by seismographs,
like that shown at left. Unfortunately, vibration monitoring of this sort is only rarely performed during construction projects, even when such monitoring is a contractual obligation (as in most Federally-funded road construction). Calculations often
become the only way to estimate vibration velocities in a given construction operation or damage possibly stemming from it. Variations in Created Vibrations and Their Transmission The
specific way that the vibration velocity varies with distance is affected by many variables. Some of these pertain to the factors which govern the vibration velocity created at the source, while others relate to the way in which vibrations
propagate (move) from the source and attenuate (become lessened) in the ground. A partial list of these effects follows: Source Vibration Energy Effects
- differences in vibrations created by different types of equipment (e.g. pile drivers vs. compactors),
- significantly different vibration characteristics of different versions of the same equipment (e.g. vibratory vs. oscillatory compactors, hammer vs. vibratory pile drivers),
- operator-variable settings (e.g. vibration amplitude for vibratory compactors) on a given model and type of equipment,
- operator variations in the way the equipment is used, even on the same day at the same location
- run-to-run changes to the source energy (e.g. from different blasting charge weights, short duration vibration spikes at heavy equipment start and stop, variable compaction vibration amplitudes, variable transmission of vibration to the
soil, size and type of pile driver, and many others)
- predominant direction of source vibration (to/from vs. up/down vs. side/side),
- frequency distribution of the vibration components as a function of the source and its mode of operation
Soil Vibration Transmission and Attenuation Effects
- frequency distribution dependence on distance,
- the specific vibration path through the soil (e.g. whether on the surface or at depth),
- specific pattern of
soil particle movement (e.g. Love waves vs. Rayleigh waves) with respect to the vibration propagation direction,
- vibration vector (e.g. longitudinal vs. vertical),
- soil type and composition,
- soil compaction,
- soil
moisture,
- soil stratification (i.e. layering),
- embedded soil obstacles (e.g. sub-surface boulders in glacial till and mountain soils)
- underlying geology,
- extent of natural rock fracturing,
- wave interference and reflection effects,
- localized vibration wave focusing, due to soil refraction effects,
- localized soil layer resonance with vibration waves,
- presence of structures,
- landscaping features
Not all these factors will play a significant role in affecting the vibration velocity in every setting, though, typically, a majority of them are likely to be relevant in most construction vibration situations.
Limitations in Calculating Vibration Velocities Many of these
features can be included in calculations of vibration velocities, at least in principle, if enough information is known about the vibration
source, locale soil type and underlying geology. Such detailed information about both the vibration source and the vibration attenuation environment is, at best, only rarely available in real life construction vibration examples. Other factors are so site-specific and require so much information (e.g. embedded objects, reflection and interference effects, presence of buildings, landscaping) that they are virtually impossible to
take into account fully in
the general-use equations commonly employed for predicting vibration velocities.
Note that none of the cited factors take into account directly variations in building resistance to vibration damage, which is a separate issue discussed in the CVDG chapter, Vibration and Damage. The many variables
which affect vibration transmission can make accurate calculations of vibration velocities challenging, in the absence of substantial validation of the calculation results by comparison with measurements made literally on the site of interest. However, calculating (and measuring) how vibration velocity changes with distance is
central to
an ability to estimate "safe distances" (check the CVDG Pro's Vibration Safety chapter for more on such estimates) from construction work or to use vibration propagation equations meaningfully in any other way.
Thus, such calculations are widely used, even if, all too often, with limited accuracy, improper interpretation and over-reliance on the specific numerical result. Simple Estimates of Vibration Velocities One of the most commonly used
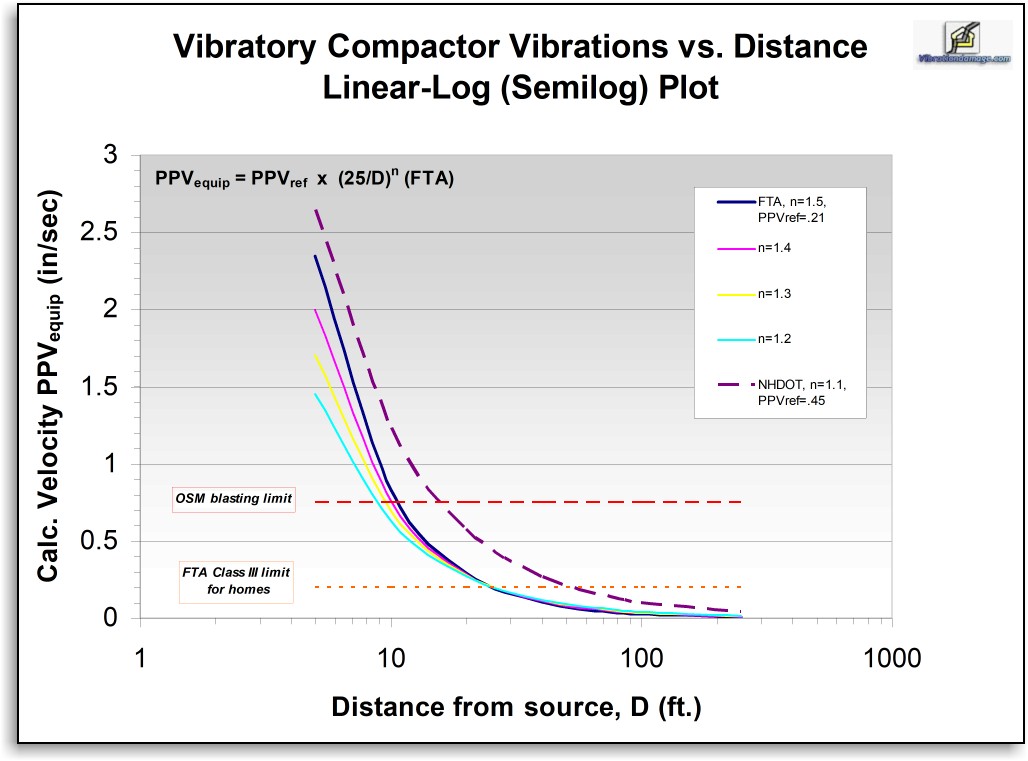
relationships for estimating construction-related vibration velocities is that offered in the U.S. Federal Transit Administration's Noise and Vibration Manual:[1] PPVequip = PPVref x (25/D)1.5
where: PPVequip is the calculated peak particle velocity in units of in/sec of
the construction equipment type at the distance of interest, PPVref is the reference vibration level for that type of construction heavy equipment in in/sec at the reference distance of 25 feet, from Table 12-2 of the FTA Noise and
Vibration Manual,[1] and D is the distance from the equipment to the structure or seismograph, in feet. This equation combines all the physical details of vibration movement ("propagation"
or "attenuation") through the ground in the 1.5 exponent and all the
characteristics of the source vibration in the reference velocity, PPVref, which is a reflection of the source energy and how efficiently that energy is transmitted to the ground.[36] In this equation, the distance from the vibration source, D, is in the denominator of the fractional rightmost factor. So, the
calculated vibration PPV decreases as the distance increases, just as you would expect. The FTA equation is phenomenological - it is fitted to vibration data, using measured reference values for equipment vibration, rather than
taking into account directly in its factors most or all of the known physical variables which affect vibration propagation. Thus, there is limited direct relationship between its parameters and fundamental quantities affecting vibration
transmission which one can relate back to physical laws, source energies and soil properties. It is a considerably simplified, but often useful, approach to describing some aspects of construction vibration transmission through the ground,
and, then, to buildings. Using the FTA Equation
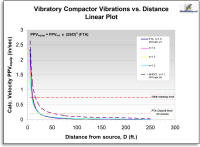
Immediately below is plot of calculated ground vibration velocities for vibratory compactors, according to the FTA equation. In this semilog plot, the velocities are
plotted on the vertical scale with equal distances between equal values (i.e. linear), while the distance scale is logarithmic,[7] with powers of ten (1, 10, 100, 1000, etc.) of the distance having equal separations. Such
logarithmic plots enable one to see better the relationships when large spans of numbers are to be shown. That fact can be easily seen by comparing this plot with the small all-linear version at the start of this chapter.
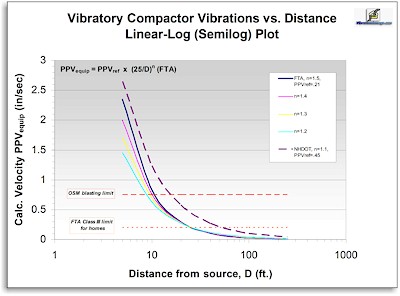 The velocities calculated in the diagram above are for various values of the
FTA equation exponent, as might be needed for soils of differing type,
using a vibratory compactor with an FTA reference velocity, PPVref, of 0.210 in/sec.
Also shown are values calculated from more recent, revised values of the exponent and PPVref from a U.S. state of New Hampshire Department of Transportation (NHDOT) study.[2],[3]
This diagram illustrates that the value one calculates for a vibration velocity at a specific distance is determined by the choices of PPVref and the exponent that one makes. If values for these parameters are chosen
which do not reflect or properly account for the actual source vibration characteristics, the local soil and geology conditions, or other factors not explicitly included in the equation (e.g. wave reflection and interference), the calculated values will differ,
sometimes substantially, both from values calculated using other numbers for PPVref and the exponent - and from measured
vibration velocities. Vibration Velocity Calculations and Standard Limits The OSM blasting standard limit for
vibration mid-frequencies in undamaged homes of modern construction, without plastered walls, and the
FTA Class III limit for timber-framed homes are also shown as horizontal lines in the diagram. "Acceptable" vibration peak particle velocities for each of those two standards lie below the lines shown. Velocities exceeding those standards lie above the dotted horizontal lines. Any vibration velocity above these standards has a higher,
and rapidly increasing, probability of causing damage than one falling below the standard, at least in the circumstances for which the standards are intended (see
the CVDG chapter
Vibration Standards for more about ground vibration standards and their use and Vibration and Damage for more on damage probabilities). The OSM standard is only applicable to examples where the
vibration source is blasting, either in mining or, with less assurance, in construction. Construction heavy equipment-caused vibration should be governed by the one of the FTA limits in the U.S., of which the Class III limit for
timber-framed homes (most homes in the U.S.) is shown in the diagrams in this chapter. The related Swiss
machines and traffic standard is also relevant for construction ground vibration and more confining than the FTA standard (see Vibration Standards for more detailed information)
in several ways.
None of the curves in this chapter show predicted home
or building vibration velocities. The structure velocities are both structure type and position-dependent. They may be
substantially higher (see Resonance/Fatigue for more on this) than the ground velocity, due to varying degrees of resonant amplification of the
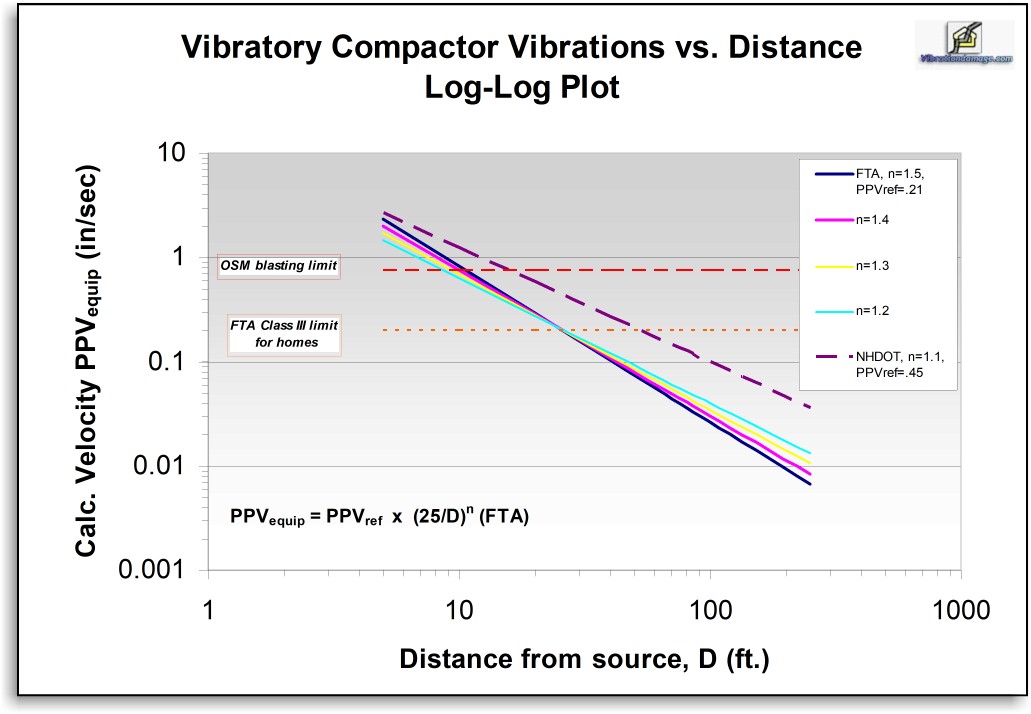
ground vibration in the structure.[27] Another Depiction In the next diagram below, the same
calculations are represented on a "log-log" plot, in which
both the
calculated velocity on the vertical scale and the distance on the horizontal scale are logarithmic. This depiction is the way that such vibration velocity/distance relationships are usually shown in the scientific literature.
It allows a wide range of values to be shown on both the vertical and horizontal axes. Plotting the calculations in this way has the effect of turning the exponential curves into lines with a slope, -n, of the FTA equation exponent.[7]
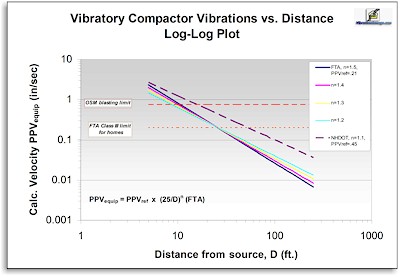 As the diagram shows, there are significant differences in the calculated velocities as one
changes the value of the exponent in the FTA equation. The less negative the value of the exponent, the slower the vibration velocities decay with distance and the farther high PPV vibrations can move before their ground PPV's fall below standard limits. Indeed, the NHDOT studies, based on newer data
for more modern road construction equipment,[2] found significant deviations from the FTA
suggested values of 1.5 for the exponent, n, and the FTA suggested PPVref value of 0.210 in/sec for vibratory compactor use at 25 feet. NHDOT found that its own data were fit better by an exponent of 1.1 and a PPVref
for vibratory compactors of 0.45 in/sec, as shown in the diagram above.[3],[16],[36] 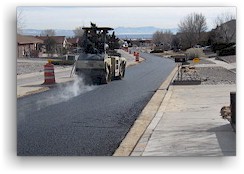 Both these changes have the effect of making the "safe distance" for such compactors considerably larger than the FTA
equation calculation indicates, as seen in
the plots in this chapter. The more up-to-date NHDOT data have the effect of doubling one estimation of "safe distance" (i.e. that distance at which the calculated vibration velocity drops below the FTA Class III standard
for timber-framed homes) for vibratory compaction (as seen at left) from about 30 feet to over 60 feet. Note that the compactor in the photo is being used considerably closer to homes than 60 feet.[4],[24]
Extensive damage to many homes was done during the road reconstruction project shown in the photo. Both these changes have the effect of making the "safe distance" for such compactors considerably larger than the FTA
equation calculation indicates, as seen in
the plots in this chapter. The more up-to-date NHDOT data have the effect of doubling one estimation of "safe distance" (i.e. that distance at which the calculated vibration velocity drops below the FTA Class III standard
for timber-framed homes) for vibratory compaction (as seen at left) from about 30 feet to over 60 feet. Note that the compactor in the photo is being used considerably closer to homes than 60 feet.[4],[24]
Extensive damage to many homes was done during the road reconstruction project shown in the photo.
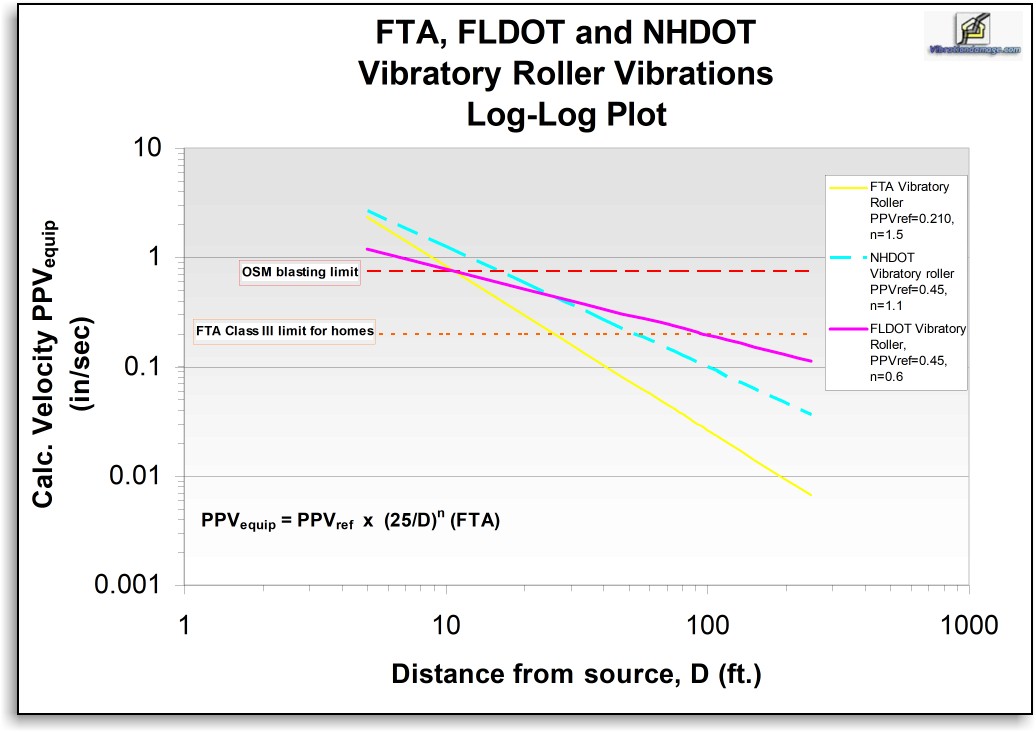
Neither the FTA nor the New Hampshire vibration attenuation equation parameters are necessarily appropriate for all locales. Indeed, there are some areas where vibration attenuation is much less rapid than in the studies on which the parameters are
based. For example, a study for the U.S. state of Florida
DOT,
with 170 data points involving
vibratory and static compactor use over various compaction bases throughout Florida, shows an exponent, n, of -0.6, indicating a much slower decrease in the PPV as distance increases than in either the New Hampshire or original FTA reports. The range of PPV's at or near 25 feet (the FTA reference distance) for the compaction work
in Florida covers a range from 0.05 in/sec to 0.5 in/sec, depending on compacted material,
with most measurements near the upper end of the range.[20]
Just below is a comparison of calculated vibration velocities for vibratory compactors, using the FTA, FLDOT and NHDOT parameters in the FTA equation. The diagram shows that a calculated "safe distance" (i.e. that distance at which the
vibration velocity falls below the FTA Class III limit) ranges from around 25 feet for the FTA parameters, to nearly 60 feet for the NHDOT parameters, to 100 feet for those calculated from the extensive
FLDOT study
results.[21],[24] 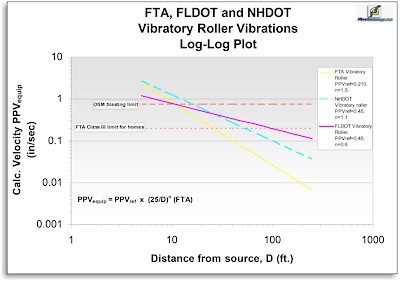
We consider the New Hampshire
data to be instructive, representative and reasonably conservative with respect to vibrations in most, but not all, other locations. When there is predictable potential for damage to the property of uninvolved third parties, as is almost always the case in construction
damage incidence, the conservative approach is the one which should be followed. Therefore, the New Hampshire values for PPVref and the exponent of 1.1 in the FTA equation are currently the
recommended ones to use,[6],[36] in the absence of specific
and detailed vibration propagation data (e.g. like those from Florida), pertaining directly to the location of interest, which indicate use of even more conservative parameters.
Other, modified versions of the FTA equation
have been proposed and utilized for specific equipment types (e.g. pile drivers) and situations. In most of these examples, the value of the exponent n suggested is 1.1,[6] in accord with the NHDOT study. The lower value
of n results in a slower reduction of the vibration intensity with increasing distance than the FTA equation standard exponent value of 1.5 would indicate. The NHDOT and FLDOT studies, among others,[6] demonstrate that neither the 1.5 exponent nor the reference equipment
ground vibration velocities given in the FTA vibration manual are
current or appropriate in all circumstances.[2],[6]
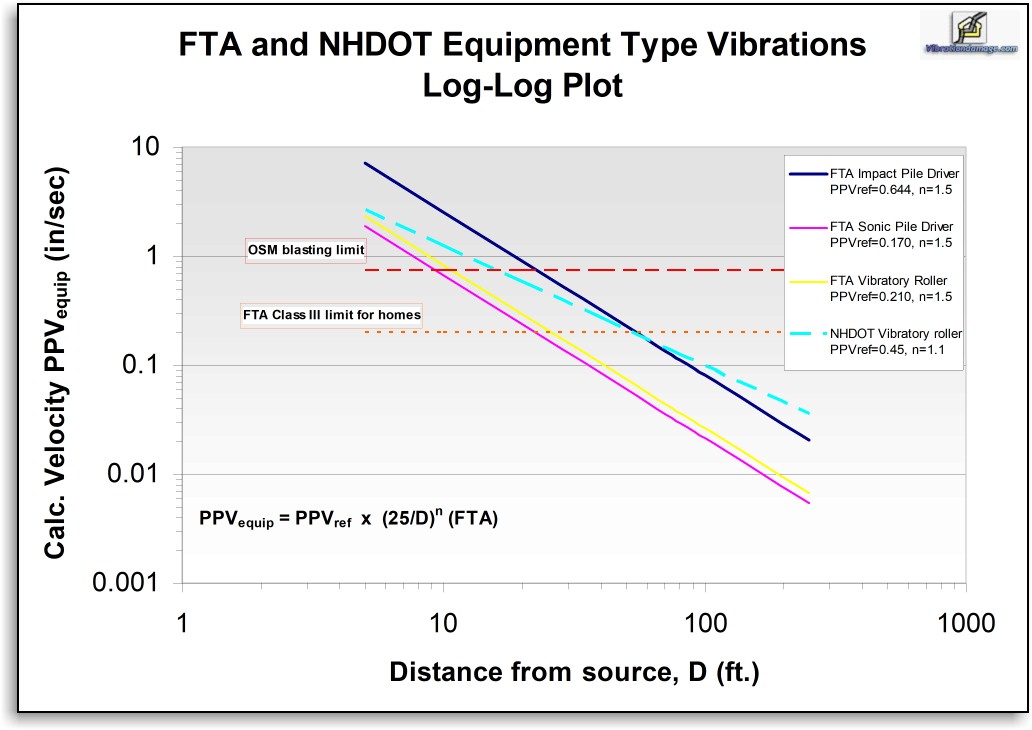
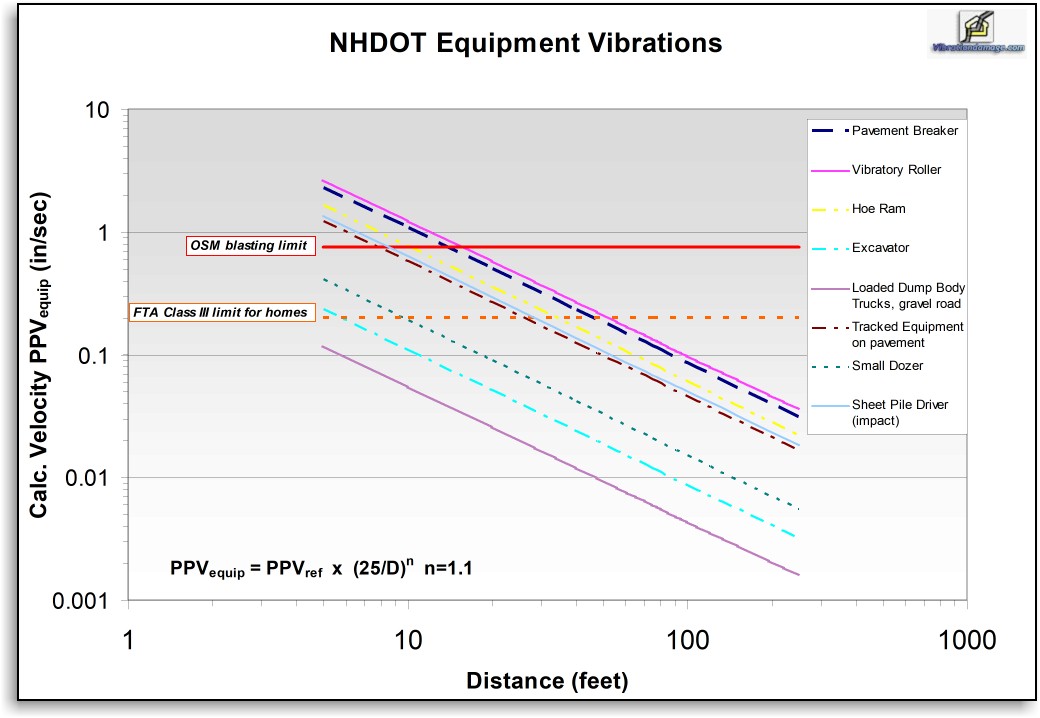
Other Equipment Types While vibratory compaction is the most common apparent damage cause reported to Vibrationdamage.com, it is not the only type of construction operation with damage potential.
Following is a comparison between FTA equation velocities calculated with parameters for both compactors and pile drivers, another class of equipment with significant damage potential.
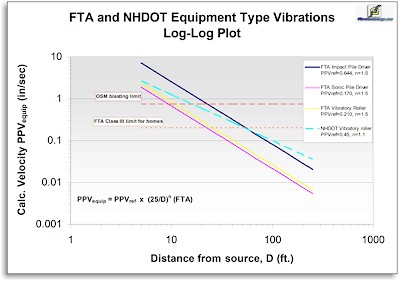 As the diagram shows, both pile drivers and vibratory compactors can produce ground vibrations whose velocities exceed the FTA Class III limit for
timber-framed homes and, close in, even the OSM mid-frequency blasting limit. The NHDOT study also provides updated PPVref values for a broader variety of
different equipment types and operations, along with the suggested value for the exponent of 1.1, for use in the FTA equation. Just below is a log-log plot of calculations with the NHDOT PPVref values
for a wider range of construction equipment.[22] 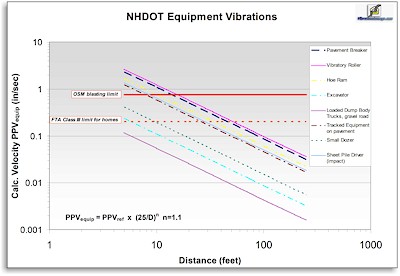 The plot shows that some operations, particularly
vibratory compaction, pile driving, use of hoe rams (hydraulic rock breakers mounted on excavators) and driving tracked vehicles over distance, can be
expected to exceed one or both standard limits over at least some distance ranges. Particular attention must be paid to all types of construction
operations to make certain that they are not carried out within those distance ranges and/or are appropriately mitigated to reduce damage probabilities (see Vibration 101
and Avoiding Vibration Damage
in the CVDG and Vibration Mitigation in the CVDG Pro for details). Another class of operations which has significant damage potential, ground impacts, is not included in the diagram, because they can be
done in so many different ways and create widely variable vibration velocities, only some of which are likely to cause damage. Demolition is one example of ground impact which can be particularly concerning, even though its vibration velocities are difficult to estimate in advance or in any given project.
Other operations, like crack-and-seat procedures, dumping rocks or broken concrete, and dynamic compaction, can also produce ground impacts which may be of concern. The calculations in these diagrams are only extended to 250 feet from the source, as the diagrams demonstrate that most forms of heavy equipment-related vibration
velocities will be below the FTA Class
III limit for homes at that distance in most locales with "normal" vibration attenuation, even when a factor of two "safety factor" is included. Conditions of low vibration attenuation (e.g. localities in Florida),
interference effects in the ground vibration, or vibration frequency-related resonance effects in the home may act to make specific examples of equipment use, and especially blasting, dangerous for homes at distances well beyond 250 feet
in some circumstances.[25],[27]
Source Energy Effects Many types of construction heavy equipment, in different models, can be used in different ways by operators which can substantially
affect the ground vibration velocities they produce. For example, pile drivers can be divided into different "energy classes" which reflect the amount of vibration energy transferred to the ground and
the ground vibration they produce. Hammer pile drivers generate more vibration at the source than resonance (or vibratory) pile drivers. Heavy truck and equipment traffic vibration depends on the weight and speed of the vehicle and the road condition. The CVDG Pro chapter, Calculating Vibration Amplitudes, has much more information on
source energy effects on vibration velocities. By way of illustration, we'll take one of the most common causes of vibration damage, vibratory compaction, and briefly explore here some of the factors which can influence how much compaction energy is
transferred into ground vibrations. 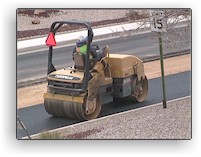 Vibratory compactors (like the examples
shown at left and above)[19] and rollers are the single most reported suspected cause of damage to homes at Vibrationdamage.com. They present special problems in prediction of
their produced ground vibrations and, thereby, their damage potential.[38] Different compactor models have different drum weights and widths, different and often
operator-variable
centrifugal force limits for the drum vibrations, operator-variable compaction amplitudes, different rates of travel, different types of vibration motions (cf. up-down vibratory vs. back-forth oscillatory compactors[11],[26] vs.
vibratory-oscillatory compactors employing both types of motion) and different, sometimes operator-modifiable, vibration frequencies.[16],[19] All of these
factors are
known to affect the velocity and frequency distribution of the ground vibrations produced when compactors are used in non-static modes.[23] Yet, full knowledge of
the state of all of them is
almost never available in real-life compaction
damage situations. Vibratory compactors (like the examples
shown at left and above)[19] and rollers are the single most reported suspected cause of damage to homes at Vibrationdamage.com. They present special problems in prediction of
their produced ground vibrations and, thereby, their damage potential.[38] Different compactor models have different drum weights and widths, different and often
operator-variable
centrifugal force limits for the drum vibrations, operator-variable compaction amplitudes, different rates of travel, different types of vibration motions (cf. up-down vibratory vs. back-forth oscillatory compactors[11],[26] vs.
vibratory-oscillatory compactors employing both types of motion) and different, sometimes operator-modifiable, vibration frequencies.[16],[19] All of these
factors are
known to affect the velocity and frequency distribution of the ground vibrations produced when compactors are used in non-static modes.[23] Yet, full knowledge of
the state of all of them is
almost never available in real-life compaction
damage situations. Compactors using lower frequency
(generally under 40 Hz) vibrations create vibrations in the ground which have greater range (and larger safe distances) than
those compactors whose nominal vibration frequencies are higher, due to more rapid attenuation (loss) of the higher frequency vibrations in the ground with distance.[17] Low frequency vibrations also transfer vibration more efficiently to
home resonant motions than higher frequency ones. The same compactor, operating with the same setup and operator, may display different dominant frequencies, depending on distance from it, as a result of
wave interference effects between
the vibrations from the two drums (see Vibration and Damage for an example and Vibration Signatures in the CVDG Pro for more on this issue).
Similarly, at startup
and stop,[37] or if vibration is not turned off when the compactor
reverses direction, as is often the case in construction work,[18]
relatively short duration ("transient")
vibrations, of considerably higher velocity than the normal, "steady-state" ones, can be produced at each reversal as a result of "pile-up" of vibrations.[11],[18]
The degree of compaction also affects the vibrations generated; initial passes of the compactor generate less ground vibration than subsequent ones, as the degree of compaction increases.[39]
Even the direction of compaction (forward vs. reverse) can influence the vibrations created.[40] The effect of the many variables which affect compactor vibrations, whose
specific contributions are usually unknown in a given situation, can mean that
calculated ground velocity values for compactors, even when reasonably close to some measured average values, may not correctly reflect true damage potential in all uses of the compactor, even for the same compactor models on the same job.[19],[35],[41] The CVDG chapter, Avoiding Vibration Damage, provides a longer description of ways to mitigate vibration in a wide range of construction operations.
Using Vibration Calculations
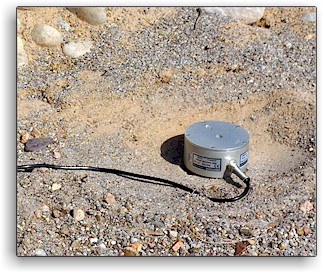 As indicated earlier, it is relatively rare for vibration monitoring to be done on construction jobs (as shown in the image at right of a seismograph transducer head in use
during a construction road repair), even though many public construction contracts require
vibration monitoring as part of their "boilerplate"
contractual conditions. Thus, the typical homeowner facing construction
vibration, and possible damage from it, will have no or limited access to measurements of vibration velocities to compare with the diagrams on this page. As indicated earlier, it is relatively rare for vibration monitoring to be done on construction jobs (as shown in the image at right of a seismograph transducer head in use
during a construction road repair), even though many public construction contracts require
vibration monitoring as part of their "boilerplate"
contractual conditions. Thus, the typical homeowner facing construction
vibration, and possible damage from it, will have no or limited access to measurements of vibration velocities to compare with the diagrams on this page.
This is one of the reasons that we have recommended that homeowners do some monitoring
of their own (see our Vibration Monitoring chapter for much more on vibration monitoring, both "professional" and "do-it-yourself") to get an idea
if felt vibrations actually have damage potential. However, in the absence of actual
data, it is important for homeowners to
know which operations have significant damage potential and which ones are of lower risk. Such information will help them in making knowledgeable judgments about felt vibrations and in understanding the real meaning of
vibration data, when the data are available or when conclusions from monitoring or calculations are offered to homeowners. Indeed, even the more recent NHDOT data underestimate
vibration velocities at distance in some areas (e.g. many parts of the U.S. state of Florida[9],[12]) which have especially low vibration attenuation, as indicated
above). Correlations exist between soil type and the value of the equation exponent, n. Softer soils attenuate vibration more efficiently (producing typical exponents up to 1.6); a 1.0 exponent is suggested for hard rock.[6]
Some locales will show values of n outside the 1.0-1.6 range (e.g. 0.6 for vibratory compaction in the Florida data). Even in relatively homogeneous and well-characterized soils, random variations in soil composition can affect
vibration velocities in largely unpredictable ways.[43]
About Construction Blasting Vibration and DistanceAlthough
Vibrationdamage.com and its Facebook page emphasize effects of vibration from construction heavy equipment, blasting is sometimes done in construction contexts to remove rock or level sites on rock. Construction blasting
differs substantially from mine and quarry blasting in the typical amounts of explosive used per delay and the frequency distribution of the produced vibration.[29] Of course, it differs from heavy equipment vibration
production, too, even though it is another energy source driving vibration, broadly similar to the driving energy provided by heavy equipment use.
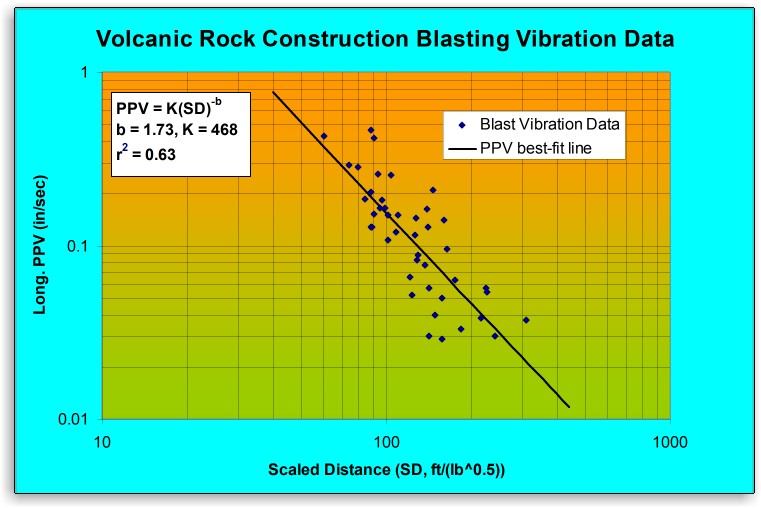
Blasting vibration-distance relationships are usually depicted differently in scientific contexts than other kinds of construction vibration. The diagram below, depicting actual blasting vibration data from a construction project
involving leveling and terracing of a planned housing development area on a volcanic rock site, [32] shows how blasting vibration velocities are typically plotted vs. a quantity
called " scaled distance", [9] rather than measured absolute distance. The scaled distance, usually denoted in the relevant literature as SD or D s, is just the measured distance between the blast and the seismograph recording the vibrations, divided by the square root of the charge weight of explosive used per
explosion
delay. [30],[31] Charge weights per delay (usually around 8-9 milliseconds between the multiple closely-timed detonations which comprise one blasting "shot") are nearly always reported in documents to local regulatory authorities
in "blasting logs", as required by local and state blasting regulations.
When seismograph monitoring is required by regulation, the measured vibrations at the seismograph locations and
their absolute distances from the blast site may also be disclosed to authorities. 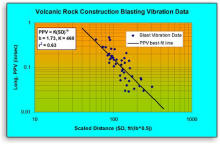 To determine whether monitoring is
required by law, the blaster must calculate the scaled distance value from the distance to the nearest structure and the charge weight to be used in the blast. When plotted with logarithmic scales on both axes, as shown in the diagram
at left, the equation describing the vibration intensity as a function of scaled distance, PPV = K(SD)-b, (often generally referred to in the scientific
literature as "power law scaling") produces a line, whose slope is generally related to the type
of soil or rock through which the vibration moves. Very soft soils or soft rock produce values of b up to about 1.8, with a typical value of 1.6; harder soils or rock produce values of b as low as 1.0.[42] This kind of exponential equation transformation
to lines on a log-log
plot is directly analogous to that seen in log-log plots of heavy equipment vibration attenuation shown earlier in this chapter.
Other information about blasting
vibration science is found throughout the CVDG, including an introduction to blasting and its effects in the CVDG chapter, Blasting Vibrations. The CVDG Pro chapter, Calculating
Vibration Amplitudes, has considerably more information about blasting vibration and means of modeling its decrease with distance.
"Safe Distances"
As indicated earlier, a calculated distance at which a
vibration velocity falls below a properly chosen standard limit can be suggestive of a "safe distance", at least for those types of activities for which the standard is intended and defined.
Properly determined and applied safe distances have value because they are easily implemented. They can provide quick insight into which operations might be considered inherently unsafe with respect to damage potential, if they
are expected to be done inside the calculated safe distance. Safe distances represent guidelines; an
operation carried out at less than the safe distance has a higher probability of causing damage than one done at a distance greater than the safe distance for that operation. Given the sigmoidal shape of the damage probability-velocity curves (see
Vibration and Damage), the damage probability increases rapidly, the further inside the safe distance one encroaches, or, put another way, the more one exceeds the
ground vibration standard PPV limit.
The FTA attenuation equation, and
modifications of it,
can be used to approximate "safe distances" for construction operations, as illustrated in the diagrams above and at left. Minimum safe distances can be derived by
calculating directly using a version of the FTA equation[33] (or reading off the diagrams above) the distance at which the PPV drops below
the standard. Because safe distances determined in this way are
subject to the inherent errors and limitations of the velocity calculations, as well as the statistical uncertainties underlying the standards on which they are based, they are best considered as minimum safe distances. For this reason and others,
prudence requires that
calculation-based safe distances always have at least a factor of two safety margin applied to them, as discussed further below.
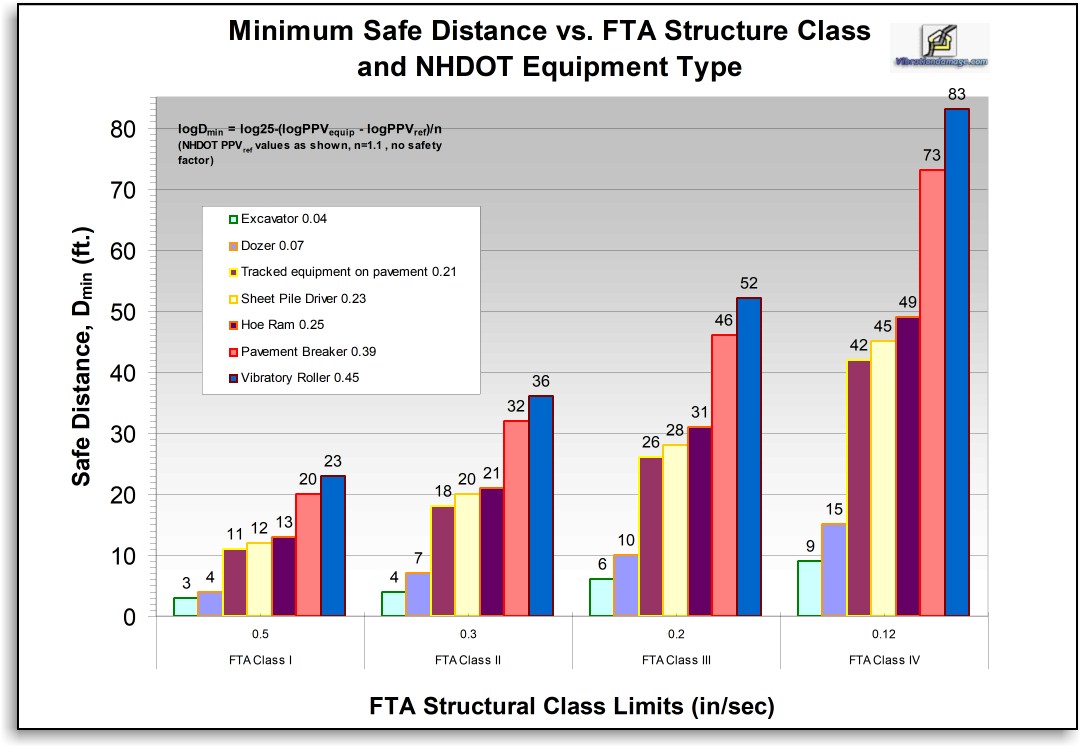
The graphic below shows some minimum safe distances in feet (without safety factors)
calculated in this way for various pieces of construction equipment, using the FTA
propagation equation with the more up-to-date equipment reference PPV's and 1.1 propagation exponent from the NHDOT.[24]
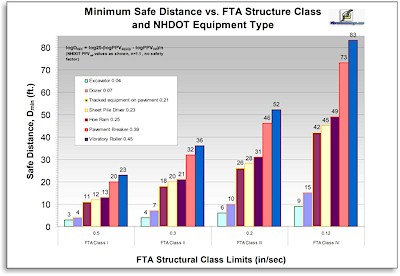
The safe distance values indicated may be conservative (i.e. "too far") in some locations having soils and geology exhibiting more negative propagation exponents than the NHDOT suggested value of 1.1 and overly optimistic (i.e.
"too close") in other locations, like much of
Florida in the U.S., with lesser attenuation exponents.
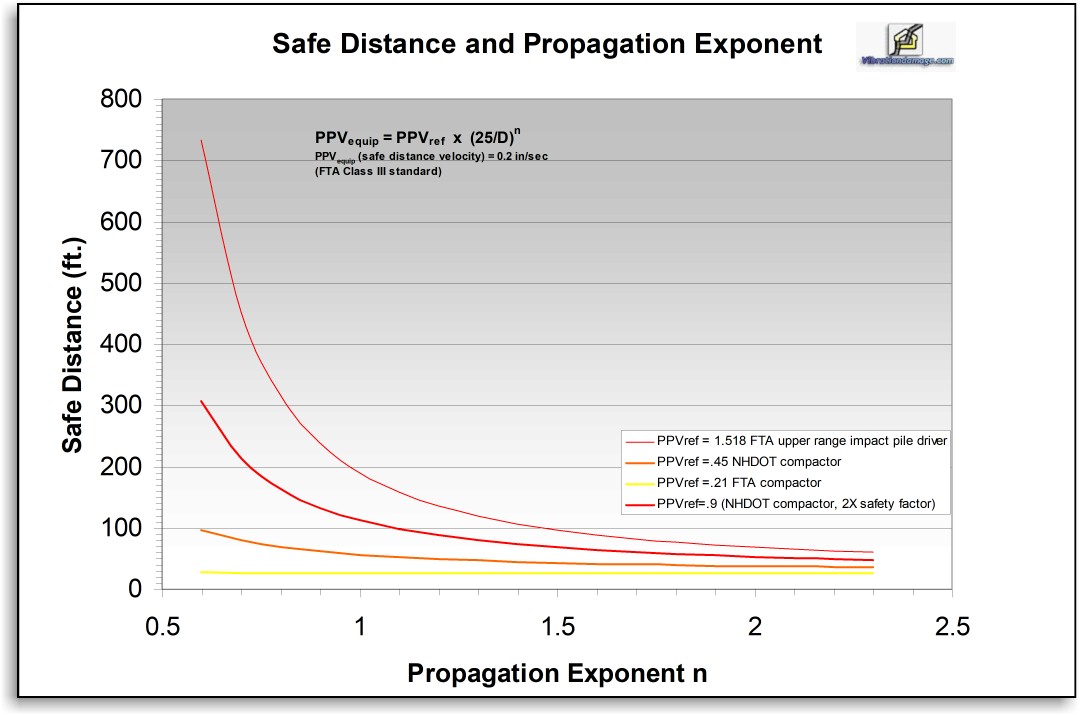
The effect of the attenuation exponent,
n in the FTA equation, on the calculated safe distance (using the FTA Class III standard velocity limit of 0.2 in/sec) is shown in the graphic at right for several different heavy
equipment types.[33] 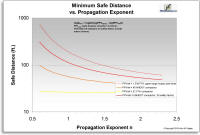 As can be seen in the diagram, the higher the value of n, the faster the vibration dissipates and the lesser the calculated "safe distance". This variable is discussed more fully in the CVDG Pro's Calculating
Vibration Amplitudes chapter. There are even variations within types
of operations done with different models of the same general equipment type.[11] As can be seen in the diagram, the higher the value of n, the faster the vibration dissipates and the lesser the calculated "safe distance". This variable is discussed more fully in the CVDG Pro's Calculating
Vibration Amplitudes chapter. There are even variations within types
of operations done with different models of the same general equipment type.[11]
There will be some circumstances in which construction operations must be performed inside safe distances to which safety factors have been applied. In those examples, simple mitigation steps
must be taken to limit vibration and vibration monitoring carried out to assure the success of mitigation. More technical information on the meaning, applicability of, and cautions involved in using vibration safe distance
calculations, with additional safe distance diagrams, can be found in the CVDG Pro's Vibration Safety chapter. Registered CVDG and CVDG Pro users also gain free access to our Ground Vibration PPV and Safe Distance Calculator, which allows them to do calculations, specific to their own
situations, rapidly and simply.
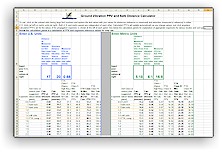 The diagrams and Calculator (one part of which seen at left) can be used to verify claims made by construction companies regarding expected vibration velocities, estimate vibration
velocities, when no monitoring data are available, approximate safe distances for a variety of construction operations and local soil and geological conditions and identify potentially damaging construction
operations which are close enough to structures to require vibration mitigation steps. The Calculator also has a blasting vibration calculator which uses the scaled distance approach and a blasting damage probability
calculator. The diagrams and Calculator (one part of which seen at left) can be used to verify claims made by construction companies regarding expected vibration velocities, estimate vibration
velocities, when no monitoring data are available, approximate safe distances for a variety of construction operations and local soil and geological conditions and identify potentially damaging construction
operations which are close enough to structures to require vibration mitigation steps. The Calculator also has a blasting vibration calculator which uses the scaled distance approach and a blasting damage probability
calculator. Proper Use of Vibration Calculations
Sometimes, vibration propagation equations are used inappropriately and without benefit of current scientific understanding of the appropriate exponent and PPVref for a given construction location and operation.
Such uncritical application of the equations can lead to even larger errors in calculated safe distances with respect to measured velocities than those inherent in the calculations and the standards. Anyone presented with the results of such calculations should take
care to determine which vibration propagation equation was employed for the calculation and the suitability of the parameters used in it. These factors entirely determine the result, its meaning, and its applicability in a given situation and locale.
Correct and judicious use of appropriate ground vibration standards, combined with careful and scientifically valid vibration monitoring, can provide a sense of reassurance regarding vibration
damage potential. Such an approach is not a "guarantee" of vibration safety, but it is far better than just guessing or hoping that damage will not be done. It is overwhelmingly more desirable than dealing with actual
damage after it has occurred. Of course, there is simply no substitute for actual vibration monitoring done on the job itself.
A Note on
Historic, Culturally-Important or Damaged Structures 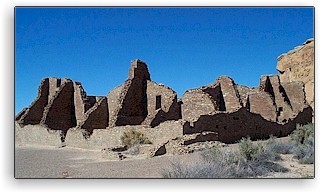 The OSM velocity limit for blasting and the much lower
construction-based FTA Class III limit for
timber-framed homes, shown in the diagrams above, are not applicable for historic structures or those which have already suffered vibration damage. Typically, among the highest velocity (PPV) limits recommended in the scientific literature for such
structures is the FTA Class IV limit of 0.12 in/sec (cf. FTA Class III limit of 0.2 in/sec shown in the diagrams above). A limit of 0.08 in/sec has been advised for the thousand-year-old masonry structure, Pueblo Bonito (seen at right), in
Chaco Culture National Historical Park in New Mexico, USA.[13] Vibration velocity limits as low as 0.05 in/sec appear in the literature for
other historic structures.[14] These lower limits have the effect of
increasing safe distances, calculated using diagrams like the ones in this chapter, for historic or damaged structures (see Vibration and Damage and Vibration Safety in the CVDG Pro for examples illustrating this point). The OSM velocity limit for blasting and the much lower
construction-based FTA Class III limit for
timber-framed homes, shown in the diagrams above, are not applicable for historic structures or those which have already suffered vibration damage. Typically, among the highest velocity (PPV) limits recommended in the scientific literature for such
structures is the FTA Class IV limit of 0.12 in/sec (cf. FTA Class III limit of 0.2 in/sec shown in the diagrams above). A limit of 0.08 in/sec has been advised for the thousand-year-old masonry structure, Pueblo Bonito (seen at right), in
Chaco Culture National Historical Park in New Mexico, USA.[13] Vibration velocity limits as low as 0.05 in/sec appear in the literature for
other historic structures.[14] These lower limits have the effect of
increasing safe distances, calculated using diagrams like the ones in this chapter, for historic or damaged structures (see Vibration and Damage and Vibration Safety in the CVDG Pro for examples illustrating this point).
Other Ways of
Calculating Vibration Velocities There are other, more complicated, less phenomenological, equations which can be
used to calculate predicted vibration velocities at specific distances in construction and blasting environments. Some are simple adaptations of the FTA equation, whose modifications better account for those types of equipment which have variable source energies
(e.g. pile drivers, vibratory compactors and pavement breakers).[6],[38] A few variations in vibration calculation approaches are discussed in more detail in the CVDG Pro chapter, Calculating Vibration Amplitudes.[9] However, none of them, no matter how
many physical parameters are included, can take into account all location-specific variables like vibration wave interference, wave refraction and wave reflection from nearby building foundations, underlying rock layers, buried obstructions, and landscaping effects. Nor do they
directly account for resonant amplification-related damage potential in homes, especially where vibration duration becomes a factor, as in construction.[10]
The more advanced forms of vibration velocity calculation are valuable scientifically and theoretically. Their importance should not be underestimated. However, they do not guarantee greater accuracy in calculation of velocities
in a specific situation and at a specific structure than do simpler calculation methods. Applicability of Vibration Calculations
Calculations of vibration PPV's assume a greater importance than their usual accuracy might warrant, because vibration monitoring is so rarely done on construction jobs, even when required by contract or regulation.
Even when it is done, the monitoring data may not be acknowledged or made available by contractors. I have not tried to present here a complete analysis of all the ways of calculating how vibration velocities vary with distance, as such an analysis is probably well beyond the needs or interest of most people. However, it is fair to say that all the calculation approaches that have been developed to date have limitations in scope, accuracy
and applicability. They also usually suffer from a lack of applicable data at a given site for best implementation of them. Both
comparison of calculated velocities with measured data and the limitations of the equations themselves suggest that even the more physically-realistic equations can be considered only as ways of approximating actual ground
vibration velocities and the related "safe distances". Even when local soil conditions are explicitly measured and taken into
account, these more advanced approaches to vibration velocity/distance relationships can be in error with respect to measured vibrations by a factor of two or more.[5] This is the reason that we have recommended
throughout the CVDG (e.g. Vibration Regulation) that, when calculations are used to estimate vibration velocities, they be subjected to careful validation in the
locale of interest and at least a two-fold safety factor be built into any velocity standard or "safe distance" derived from them.[31] Any vibration-causing operation with a calculated PPV near the upper limit of that two-fold safety
factor calls for implementation of mitigation measures. Vibration velocity calculations can be very valuable in understanding how far from
the vibration source damage might occur and under what conditions. But, that value is greatly increased
when the equations are employed with real understanding of how they can be scientifically applied in the local vibration environment and what their limitations might be.[34]
[1] Transit Noise and Vibration Impact Assessment, Carl E. Hanson, David A. Towers, and Lance D. Meister, FTA-VA-90-1003-06, May 2006,
p. 12-11; A later version, with the same standards and equations is: High-Speed Ground Transportation Noise and Vibration Impact Assessment, Carl E. Hanson, P.E., Jason C. Ross, P.E., and David
A. Towers, P.E., DOT/FRA/ORD-12/15, September 2012. These are often referred to as the "FTA Noise and Vibration Manual".
↩
[2] Ground Vibrations Emanating from Construction Equipment, R. M. Lane and K. Pelham, New Hampshire Department of Transportation, Report # FHWA-NH-RD-12323W, 2012, p. 47.
↩
[3] In this diagram and the subsequent ones, the FTA PPVref used is the one characterized by the FTA report writers as "typical", not those listed as "upper range". Similarly, the PPVref referenced in the NHDOT study mentioned later is the one
characterized as "average", not the highest measured. For equipment with "upper range" PPVref, the effect is to "raise" the lines on the log-log plots shown in this chapter by the difference
between the "typical" and "upper range" values, without changing their slopes. This increases "safe distances" accordingly. The original source data from which the FTA PPVref
values are derived range from over 20 to over 50 years old, while those from the New Hampshire study are for considerably more modern (2012) equipment. We chose to use the FTA equation for the diagram calculations
in this chapter of the CVDG
for several reasons: 1) It is focused and based on construction vibration, 2) relevant parameters for various types of construction operations and equipment are widely available in the scientific literature, and 3)
other, more physically realistic approaches, lack those parameters in a wide enough set of circumstances to be generally useful.
↩
[4] This increased safe distance for vibratory compactors may help explain why one contractor, in two different projects, did extensive damage using vibratory compactors less than 40 feet from homes. Also contributing to the damage was the contractor's
improper application of the OSM
blasting vibration standards, rather than construction vibration standards. The contractor's own partial (in several senses) vibration monitoring data showed that it exceeded even the blasting standards in at least ten examples
during one of
those two road reconstruction projects. The contractor did not perform vibration monitoring on the second project, though mandated to do so by the project bidding instructions.
↩
[5] See, for example, Soil and Structure Vibrations from Construction and Industrial Sources, Svinkin, Mark R., International Conference on Case Histories in Geotechnical Engineering. 8. (2008). (available online)
↩
[6] For a good summary of these, see Transportation and Construction Vibration Guidance Manual, Jim Andrews, David Buehler, Harjodh Gill, Wesley L. Bender, California Department of Transportation, Division of
Environmental Analysis, Environmental Engineering, Hazardous Waste, Air, Noise, & Paleontology Office, Sacramento, CA, 2013, Chapter 7. The guidelines given there are approximate; there is wide variation in
measured attenuation exponents, even for soils of nominally the same type. Such variation is one of many complicating factors in prediction of vibration PPV's by calculation.
↩
[7] Logarithms are simply the power to which a number has to be raised to produce a given number. 10 raised to the power of 1 is 10; hence the logarithm (log) of ten is one. 10 raised to the power of 2 (10x10 or 102) is 100. Thus, for logarithms of
base ten ("log10 x", "log x", "base ten log of x"), the log of 100 is 2. The log of 1000 (10x10x10
or 103) is 3, i.e. 103 is 1000. Fractions of ten are denoted by
negative exponents. 0.1 is 10-1 and the log of 0.1 is -1. Many scientific equations use
"natural logarithms", which are usually denoted as "ln". The base of the natural logarithm system is the number, e, (approximate value, 2.7182818...), a non-repeating, non-terminating
transcendental
number, like π (the ratio of a circle's circumference to its diameter, 3.1415926...). When you read scientific papers, you'll often see equations using e and ln. All the
log plots in this chapter
use base ten logs. Plotting vibration data on a log-log plot is equivalent to taking the log of both sides of the general propagation equation PPV = kD-b, giving the equation, log(PPV) = log(k)- b x log(D).
This equation describes a line with a value of log(k) at one unit of distance and slope -b.
↩
[8] Diagrams like those on this page, which were generated in Excel, can be easily created on a computer or graphing calculator, by providing the desired values for the exponent and the PPVref in the
FTA equation or any of the related ones. A hand calculator or smart phone can be used in the same way to produce values of calculated velocities at single distances. Even if the PPVref isn't known for
a given piece of equipment or locale, you can easily fit the data from vibration measurements at various distances, if those are available to you. If you have sufficient velocity/distance data, you can derive your own effective PPVref
and exponent from it. ↩
[9] Mining operations which carry out blasting use the scaled-distance equation, v=K(D/√W)-b to calculate vibration velocities at distance from the blast. The quantity, D/√W,
is the scaled distance. The equation W = (D/Ds)2, can be employed to determine the allowable charge-weight of explosives to be detonated in any specified delay period without required
seismic monitoring, where
W = the maximum weight of explosives, in pounds; D = the distance, in feet, from the blasting site to the nearest protected structure; and Ds = the scaled-distance factor. Ds has units of
ft/(lb)0.5. Blasts are usually set off with very short (typically a few thousandths of a second) delays between blasts, both to minimize ground vibration and do a better job of pushing the broken
rock away from the mine face. Allowable scaled distance factors for mining are set by government regulations of the Office of Surface Mining (OSM) in the U.S. Such equations involve distances, but the main focus of
them is the charge weight of explosive which can legally be used in blasting. The charge weight per delay is proportional to the energy released in the blast.
Scaled distances are widely used in the scientific literature for analysis of vibrations caused by blasting in construction, as well as
mining. For more on scaled distance approaches in blasting and regulatory requirements in the U.S., see OSM Blasting Performance Standards, 30 Code of Federal Regulations, Sec. 816.67 and OSMRE Blasting Guidance
Manual, Michael F. Rosenthal and Gregory L. Morlock, Office of Surface Mining Reclamation and Enforcement, United States Department of the Interior,
1987
A variation of a scaled distance equation, v=k(D/√Wr)-n, where v is the velocity, D is the distance, Wr= energy of source, and k = value of
velocity at one unit of scaled distance, (D/√Wr), has been used successfully for construction vibration settings, particularly for pile driving (Damage Effects
of Pile Driving Vibration, John F. Wiss, Highway Research Record, 155, 1967, pp 14-20, Highways Research Board, Washington, DC.). The value of n is related to the vibration
attenuation in the soil. The higher the value of n, the faster the vibration velocity drops with distance. The value of k is inversely proportional to the attenuation in the soil. It provides a measure of the
vibration velocity at one unit of scaled distance. The point of scaled distance
approaches to estimating vibration intensities is to place the source energy differences from the vibration propagation on the same scale, by the square root scaling, thereby isolating soil attenuation effects. See Evaluation of Vibration
Limits and Mitigation Techniques for Urban Construction, M. E. Bayraktar, Y. Kang, M. Svinkin, F. Arif, Florida Department of Transportation Report, October 31, 2013, p. 42, et seq., for some field measurements of k.
↩
[10] The calculated FTA PPVequip, using the FTA 1.5 exponent and the FTA PPVref, was 0.374 in/sec for a compaction operation, over soil classified as silty sand, in one road reconstruction project in New Mexico, USA. The observed maximum PPV was 0.660 in/sec, a value in violation of all
building class limits in the FTA standard, as well as the 0.5 in/sec Safe Blasting Level for homes with plastered walls in USBM RI 8507. There were over twenty measurements above 0.5 in/sec in front of this home. Another home, one intervening property from the one above, the same distance
away from the paving operation, using the same vibratory compactor at the same compaction vibration amplitude a few minutes after the 0.660 measurement at the other property, experienced a maximum vibration velocity of
0.315 in/sec (cf. calculated value of 0.374 above), measured with the same seismograph. It is very unlikely that such large difference can be attributed to soil, geology or equipment use variations under
these conditions. Probably, these differences were due to vibration wave interference effects, perhaps resulting from the much different landscaping of the two properties. Whatever the cause of these
differences from calculated values might be, this
real-life road construction example shows why vibration calculations should be considered as approximate, with factor of two variations from measured values easily possible. It isn't known if the two homes mentioned here
were damaged in the work, but extensive damage appeared in many other homes along the path of the work, which experienced lower measured vibration velocities, as indicated in footnote 4.
↩
[11] Ambient vibration of oscillating and vibrating rollers, J Pistrol, F. Kopf, D. Adam, S. Villwock, W. Völkel, Vienna Congress on Recent Advances in Earthquake Engineering and Structural Dynamics 2013
(book), p. 6 (available online)
↩
[12] Assessment of Blast Vibration Impacts from Quarry Blasting in Dade County, David E. Siskind & Mark S. Stagg, May 10, 2000
↩
[13] Seismic and Vibration Hazard Investigations of Chaco Culture National Historical Park, Kenneth W. King, S. T. Algermissen, and P. J. McDermott, USGS Open-File Report 85-529, 1985; Bonito Vibration
Tests, Chaco Culture Historical Park, K. King, D. Carver, and B. Winslow, Open-File Report 91-444, 1991
↩
[14] A good summary of some of that literature can be found in Construction Practices to Address Construction Vibration and Potential Effects on Historic Buildings Adjacent to Transportation Projects,
National Cooperative Highway Research Program (NCHRP), Project 25-25 (Task 72), Richard A. Carman, September 2012
↩
[15] You can get distances from your home or building to construction work sites from a free, downloadable computer program, Google Earth, using it's Tools, Ruler feature. Google Earth uses satellite photos to allow you to measure
distances without ever leaving your home or office. Virtually the entire land surface of the planet has coverage. The program also allows you to look at street-level photos for most towns and cities in developed
countries. You can also use Google Maps online to accomplish some of the same things.
↩
[16] The only identification in the NHDOT report (footnote 2) of which vibratory compactor model(s) were represented in vibration data collected for the report is a photo of an Ingersoll-Rand SD-122DX vibratory
roller in Figure 3 of the report. Published specifications for this model indicate that it has vibration frequencies of 30.9 and 33.8 Hz, with high and low centrifugal force limits of 281 and 206 kiloNewtons, kN, respectively.
↩
[17] Construction Vibrations and Their Impact on Vibration-Sensitive Facilities, Hal Amick and Michael Gendreau, Presented at ASCE Construction Congress 6, Orlando, Florida, February 22, 2000 (available
online), p. 8
[18] Ground Vibrations Emanating from Construction Equipment, R. M. Lane and K. Pelham, New Hampshire Department of Transportation, Report # FHWA-NH-RD-12323W, 2012, p.
9.
↩
[19] Illustrating this point are the very different vibratory compactors used in two jobs done by the same contractor in the same municipality. The Caterpillar CB-334 compactor shown above has a maximum
centrifugal force of 33.1 kN, per drum, with a nominal vibration frequency of 69 Hz. Another compactor, used on the same job, an Ingersoll-Rand DD70HF, seen in the second compactor photo, has a specification centrifugal force range of 34-94 kN, with a vibration
frequency of 66.7 Hz. Yet another compactor, used by the same contractor on a nearby job in the same municipality, a Volvo SD-115B, had a specified vibration frequency range of 30.8-33.8 Hz, with a centrifugal force
range of 208 to 258 kN.
↩
[20] Evaluation of Vibration
Limits and Mitigation Techniques for Urban Construction, M. E. Bayraktar, Y. Kang, M. Svinkin, F. Arif, Florida Department of Transportation Report, October 31, 2013, p. 76. This study also provides some
comparison numbers for static compaction. There is little information in the study about the compactors used, their frequencies or their centrifugal force limits.
↩
[21] The unusually low attenuation of vibrations in Florida may help explain why Florida is over-represented, relative to construction value in the state, among reports of damage to Vibrationdamage.com. See Damage Statistics in the CVDG Pro for more on this
matter.
↩
[22] For those who may be unfamiliar with the names and appearance of different types of construction equipment, the NHDOT report (footnote 2) has example photos of most of these equipment types in use. Although
equipment appearance can vary substantially from model to model, there are usually enough common features to allow identification of the equipment from such photos.
↩
[23] Basic Principles of Asphalt Compaction, BOMAG GmbH, 2009
↩
[24] None of the "safe distances" discussed in this chapter, arrived at by noting where the velocity/distance curve crosses the FTA Class III limit shown, have safety factors included. The FTA construction
standards, which are based on the "Swiss standards", have safety factors built into them. Safety factors built into construction standards are probably adequate in most environments. However, one still
must add safety
factors to any velocities derived from calculations for the reasons indicated in the main text. Pre-construction survey distances, used by contractors in planning pre-construction surveys, are related to
safe distances, but are usually larger still, since they must account, at a minimum, for normal statistical variation that can lead to damage farther from the work than the "safe distance".
↩
[25] Soil and Structure Vibrations from Construction and Industrial Sources, Svinkin, Mark R., International Conference on Case Histories in Geotechnical Engineering. 8. (2008). (available online)
↩
[26] Oscillatory compactors impart only about 15-25% as much energy to the soil as vibratory compactors operating under the same conditions. This nearly halves the "safe distance" for them, relative to vibratory
compactors, calculated according to several standards. An additional benefit is that they achieve higher degrees of compaction faster than vibratory compactors, thereby saving the contractor time and money and
nearby homes greater vibration exposure. See Ambient vibration of oscillating and vibrating rollers, J. Pistrol, F.
Kopf, D. Adam, S. Villwock, W. Völkel, Vienna Congress on Recent Advances in Earthquake Engineering and Structural Dynamics 2013 (VEESD 2013), C. Adam, R. Heuer, W. Lenhardt & C. Schranz (eds) (available online)
↩
[27] "The condition of resonance can be triggered at large distances of a few hundred meters from a pile driving site and even more than one kilometer from a blasting site.", Soil and Structure
Vibrations from Construction and Industrial Sources, Svinkin, Mark R., International Conference on Case Histories in Geotechnical Engineering. 8. (2008), p. 3. (available online)
↩
[28] Effects of Repeated Blasting on a Wood-Frame House, Mark S. Stagg, David E. Siskind, Michael G. Stevens, and Charles H. Dowding, United States Bureau of Mines Report of Investigations 8896 (USBM RI
8896), 1984
↩
[29] See, for example, Structure Response and Damage Produced by Ground Vibration From Surface Mine Blasting, D. E. Siskind, M. S. Stagg, J. W. Kopp, and C. H. Dowding, United States Bureau of Mines Report of
Investigations 8507 (USBM RI 8507), 1980, p. 6, et seq.
↩
[30] The "best-fit line" in the construction blasting scaled distance diagram example is generated from statistical "least squares" calculations, whose goal is to determine the line which has the smallest sum of the squares of
the differences between
the points on the calculated line and the actual data points. The slope, b, of the calculated line is usually related to the type of soil or rock in which the vibration measurements are recorded, with larger values of b generated in softer soils,
just as in heavy equipment-caused vibration. The constant K is the calculated value of the vibration velocity (in/sec) at a scaled distance of 1 (i.e. very close to the blast). K reflects mostly the source energy
and the degree of "confinement" (e.g. mine wall face vs. isolated blast hole) of the explosion. The "correlation coefficient", r2, is a measure of how well the data points match the calculated least squares line. If all the data points were exactly on the
calculated line, r2
would be 1.0. If all the points were completely uncorrelated with the calculated line (e.g. at the four corners of a square), it would be 0.
↩
[31] The 0.63 correlation coefficient seen in this case is fairly typical of
actual blasting vibration data; some sets of blasting vibration data show still lower r2 values. Typical data scatter in these plots is a good illustration of yet another reason why calculations of vibration velocities should be treated as approximate. For example, if we look at the blasting plot at
a scaled distance of 90, the best-fit line predicts a velocity of 0.19 in/sec. Some data points are close to this value, but others go up to 0.49 in/sec, more than a factor of two difference. Cube root scaling was
tested for these data, but did not provide a better correlation of the data than square root scaling.↩
[32] The data for blasting in volcanic rock (probably dacite or rhyodacite, by appearance) shown here come from 4 different seismographs mounted in different locations at various absolute distances from 13 blasts which occurred over a period of 6 weeks,
approximately. In the case of the seismograph furthest from the blasts, some explosions did not produce vibrations of velocity sufficient to trigger the seismograph to record. These imprecise, non-triggered data
do not appear on the plot.
↩
[33] The Safe Distance vs. Propagation Exponent plot, and other similar safe distance plots, were created by algebraically rearranging the FTA equation to get the following algorithm for the log of the
minimum safe distance, Dmin:
logDmin = log25-(logPPVequip - logPPVref)/n using the FTA Class III standard maximum velocity of 0.2 in/sec for PPVequip and plotting against a range of values for n. This plot is useful
for understanding how the calculated safe distance changes as the locale soil and geology change. Except where noted, the minimum safe distances appearing in the plot do not have safety factors built into them. In all the safe
distance diagrams, distances above the relevant curves are considered "safe" with respect to structure damage, within the limitations of the calculations; distances falling below the relevant curve are considered
"unsafe". At least a factor of two safety margin should be applied to any minimum safe distance read off these plots, to provide some assurance that the distances reflect the uncertainties of variables not included within the calculation.
↩
[34] Although vibration monitoring is only occasionally performed during construction work, measured PPV's at different distances are sometimes available. When available, such measurements often lead to claims from
the vibration monitoring firms and their contractor employers that the "vibration were too low to cause damage". You can check such claims using the diagrams in this chapter, or, if you prefer, you can calculate
yourself the predicted velocity using a version of the FTA equation:
PPVstruc = PPVmeasured x (Dmeasured/Dstruc)n
where PPVstruc is the calculated PPV at the structure of interest, PPVmeasured is the measured PPV, Dmeasured is the distance from the
construction work at which the PPVmeasured was found, Dstruc is the distance to the structure from the construction work and n is the propagation exponent. Values of n can be 1.5
(FTA), 1.1 (NHDOT), 0.6 (FLDOT compactor data) or those appropriate for your local soil and geology, if known. CVDG for Homeowners PDF and CVDG Pro owners can download free the Vibrationdamage.com Ground Vibration PPV and Safe Distance
Calculator, which implements this equation for construction, as well as the scaled distance equation for blasting vibration and blasting damage probability.
↩
[35]
Another effect, regularly seen as soil progressively compacts, is the well-known phenomenon of increasing observed vibration PPV with each subsequent pass of the compactor. This effect is discussed briefly in a
real life paving example in footnote 7 of the CVDG's Vibration Potential chapter. Thus, representations of PPV's for compaction of soil will not be accurate for compaction of
asphalt nor are they likely to be reliable for compaction of a second layer of asphalt over an existing one. For a published example, see Ground Response to Dynamic Compaction, P. Mayne, J. Jones and
J.C. Dumas, ASCE Journal of Geotechnical Engineering, Vol 110, No 6 June 1984, pp 757-774.
↩
[36] Although the PPVref occurs as a separate parameter in the FTA attenuation equation, it is not truly independent from the soil attenuation environment in which it is
determined. PPVref values at the reference distance
of 25 feet differ for the same
source vibration energy as the attenuation exponent, n, varies. For more on this, including graphics showing the dependence, see the CVDG Pro chapter, Calculating Vibration Amplitudes. When adjusted for the
different attenuation exponents (1.1 vs. 1.5) prevalent in the two sets of values offered by NHDOT and FTA, the PPVref values are closer than the published numbers indicate, though still higher in the
NHDOT study.
↩
[37] "However it should be remembered that for vibrating rollers there are likely to be
transients at starting and stopping which may generate particle velocities which can be twice as large as for steady state operation." Groundborne Vibration Caused by Mechanised Construction Works, D M Hiller and G I Crabb, Transport Research Laboratory Report 429, Crowthorne,
Berkshire,UK, 2000, p. 74 ↩
[38] Groundborne Vibration Caused by Mechanised Construction
Works, D. M. Hiller and G. I. Crabb, Transport Research Laboratory Report 429, Crowthorne,
Berkshire, UK, 2000, p. 16, et seq. ↩
[39] Ibid., p. 28 ↩
[40]
Ibid., p. 90 ↩
[41] It follows from this discussion that it is all but impossible to duplicate exactly, at another location or even at the same location on a different day, the conditions
prevailing in a given instance of vibration-creating construction work. Thus, attempts to determine vibrations in separate "experiments", after the fact of damage, are scientifically questionable, at best. Such
efforts are
made occasionally, but they are no substitute for vibration monitoring carried out while the work itself is done.
↩
[42] Although the value of the exponent b is generally related to the soil type through which the vibration passes, it isn't necessarily truly constant for a given location and
soil type. Soils attenuate higher frequency vibration components more effectively than lower frequencies. Thus, a vibration with a greater amount of higher frequency components will show a different (higher) value of b than
will one composed predominately of lower frequencies, even in the same location. Since typical construction and blasting vibrations are complex mixes of frequencies, this is normally a small effect, but need not
always be so, if the frequency distributions of the vibrations differ greatly. ↩
[43] Stochastic Geologic Effects on Near-field Ground Motions in Alluvium, Robert E. Reinke and Brian W. Stump, Bulletin of the Seismological Society of America, Vol. 78
June 1988 No. 3, p. 1037 ↩
|
| |
|
|
  This is a chapter from the Construction
Vibration Damage Guide for Homeowners (CVDG), a 100+ page free
book with over 300 color photos, diagrams and other illustrations.
It is available at
https://vibrationdamage.com as a series of web pages or in full,
web navigation and ad-free,
as a downloadable PDF e-book, with
additional content not available on the web. The free
version of the CVDG is licensed to homeowners and others for
personal, at-home use only. A Professional Edition (CVDG Pro), licensed
for business use and with over three times as much content, can be ordered from our
Order the CVDG Pro page, usually with same-day delivery. You can comment about this page or ask
questions of the author, Dr. John M. Zeigler, by using our Visitor Comment
form. This is a chapter from the Construction
Vibration Damage Guide for Homeowners (CVDG), a 100+ page free
book with over 300 color photos, diagrams and other illustrations.
It is available at
https://vibrationdamage.com as a series of web pages or in full,
web navigation and ad-free,
as a downloadable PDF e-book, with
additional content not available on the web. The free
version of the CVDG is licensed to homeowners and others for
personal, at-home use only. A Professional Edition (CVDG Pro), licensed
for business use and with over three times as much content, can be ordered from our
Order the CVDG Pro page, usually with same-day delivery. You can comment about this page or ask
questions of the author, Dr. John M. Zeigler, by using our Visitor Comment
form.  If you would like to discuss vibration damage issues and view additional content not found in the CVDG, Join
us on Facebook. Please Like us while you're there. If you would like to discuss vibration damage issues and view additional content not found in the CVDG, Join
us on Facebook. Please Like us while you're there. |
| |
|