|

| |
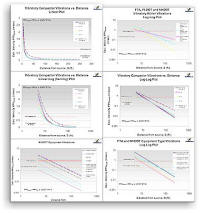
The diagrams at left, and more, are individually viewable at full size through the gallery below or downloadable free via the link. They can be used to:
- verify claims made regarding expected vibrations from construction activities,[1]
- estimate vibration
velocities,[2] when no monitoring data are available,
- approximate safe distances[3] for a variety of construction operations, building types, vibration velocities, local soil conditions and geologies
- plan for vibration mitigation steps when construction operations will be performed at potentially damaging distances.
See the Vibration and Distance chapter of the Construction
Vibration Damage Guide at
https://vibrationdamage.com/vibration_and_distance.htm or the same chapter in the PDF versions of the CVDG for much more information on the proper use of such diagrams. Read the footnotes for this chapter of the
CVDG for details of how these diagrams were generated and the assumptions which underlie them.[2] Except where noted, none of the
diagrams include factor of two safety margins, as recommended in the CVDG, for calculated vibration velocities and safe distances. See below the download link for the gallery and important information about these diagrams
 Calculated Vibration Velocity vs. Distance Diagrams Gallery Calculated Vibration Velocity vs. Distance Diagrams Gallery
|
|
|
|

|
|
|
|
Compactor Vibration vs. Distance - Linear |
|
|
|
|
|
|
|
|

|
|
|
|
Compactor Vibration vs. Distance - Semilog |
|
|
|
|
|
|
|
|

|
|
|
|
Compactor Vibration vs. Distance - Log-Log |
|
|
|
|
|
|
|
|
|

|
|
|
|
FTA and NHDOT Equipment Vibrations |
|
|
|
|
|
|
|
|

|
|
|
|
FTA, FLDOT and NHDOT Compactor Vibrations |
|
|
|
|
|
|
|
|

|
|
|
|
NHDOT Equipment Vibrations |
|
|
|
|
|
|
|
|
|

|
|
|
|
PPVref vs. Propagation Exponent n |
|
|
|
|
|
|
|
|

|
|
|
|
Minimum Safe Distance Vs. FTA Structural Class by Equipment Type |
|
|
|
|
|
|
|
|

|
|
|
|
Minimum Safe Distance vs. Propagation Exponent |
|
|
|
|
|
|
|
|
|

|
|
|
|
Minimum Safe Distance vs. PPV |
|
|
|
|
|
|
|
|

|
|
|
|
Minimum Safe Distance vs. FTA Structure Class |
|
|
|
|
|
|
|
|

|
|
|
|
Scaled Distance Plot Blasting Vibrations |
|
|
|
|
|
|
|
|
|
Diagrams ©Copyright 2018-2024 John M. Zeigler All rights reserved
| [1] Calculated ground vibration velocities or safe distances can be read off any of the diagrams whose thumbnails are in the gallery for any distance from 5 to 250 feet from the vibration
source, just by noting where the distance to the construction work (the vibration source) intersects the appropriate curve, then reading the velocity at that intersection from the vertical scale.
↩ [2] With the exception of the scaled distance blasting diagram, these plots were generated using the FTA propagation equation for construction equipment, with FTA,
New Hampshire Department of Transportation (NHDOT) or Florida Department of Transportation (FLDOT) values for
PPVref and/or n:
PPVequip = PPVref x (25/D)n
The first three diagrams show the same information, but display it in different ways, in order to provide a sense of how the different depictions change the appearance of the same information.
↩
[3] The Safe Distance vs. Propagation Exponent plot (miniature version at top of page) were created by algebraically rearranging the FTA equation to get the following algorithms for the log of the
minimum safe distance, Dmin:
logDmin = log25 - (logPPVequip - logPPVref)/n Dmin = 10logDmin using the FTA Class III standard maximum velocity of 0.2 in/sec for PPVequip and plotting against a range of values for n. This plot is useful
for understanding how the calculated safe distance changes as the locale soil and geology change. Local values for n can often be found for a given location can often be found by searching for the locale name and the words
"attenuation" or "propagation". Other safe distance plots show how the minimum safe distance varies with the vibration velocity and the FTA structural Class standards. Except where noted, the minimum safe distances appearing in the plots do not have safety factors built into them. Such values should be used with caution,
and with 2X safety factors, as described in the Vibration
and Distance chapter of the CVDG. In all the safe distance plots, safe distances lie above the relevant curve; unsafe distances are those falling below the relevant curve.
↩
|
| |
|